How to use this guide
A probability distribution is a mathematical description of uncertainty. It tells us which values a random quantity can take and how probability is assigned to those values.
This guide follows the supplied MGU syllabus for MG2DSCSTA100. It does not add proof requirements where the syllabus asks students to demonstrate properties or solve simple problems. The detailed assessment is 50 ESE theory marks (2-, 6- and 12-mark questions) and 35 practical marks; CCA includes theory and practical components. No question below is claimed to be an actual or guaranteed MGU question.
Course outcomes in plain language
- Understand random-variable and distribution ideas.
- Recognise and use the distributions listed in the syllabus.
- Analyse where distribution models are useful.
- Fit, evaluate and simulate distributions with spreadsheet tools.
Course concept map and priorities
→ FUNCTIONS & TRANSFORMATIONS → JOINT DISTRIBUTION
→ MARGINAL / CONDITIONAL DISTRIBUTION → INDEPENDENCE
→ EXPECTATION → MEAN, VARIANCE & GENERATING FUNCTIONS
→ CHOOSE A MODEL: DISCRETE OR CONTINUOUS DISTRIBUTION
→ CALCULATE PROBABILITIES / EXPECTATIONS → SPREADSHEET CHECK & SIMULATION
Each step adds a tool: first assign numbers to outcomes, then describe probabilities, summarise the random quantity, and choose a useful distribution model.
MUST MASTER: PMF/PDF/CDF distinctions, expectation and variance, standard discrete/continuous distribution problems, normal standardisation, spreadsheet work. These support several outcomes and the course’s numerical/practical goals.
IMPORTANT: transformations, joint/marginal/conditional distributions, generating functions, distribution properties and memorylessness.
QUICK-SCORE: precise definitions, support, parameter meanings, standard properties, conditions for selecting a model.
These priorities reflect syllabus outcomes, hours and assessment; they do not predict marks for individual topics.
Suggested study time: three 15-hour theory modules plus 30 hours of spreadsheet practice are listed. Outside class, revisit examples in short sessions and reserve regular time for spreadsheet record work (minimum 10 problems).
Random variable theory
You will learn: univariate discrete and continuous random variables; PMF, PDF and CDF; functions and transformations; bivariate variables; joint, marginal and conditional distributions; independence.
Why it matters: these ideas are the language used to describe chance numerically and connect outcomes with probabilities.
Concept route: random variable → probability assignment → cumulative probability → transform → pairs of variables → conditional view and independence.
1.1 Random variables: discrete and continuous
A random variable assigns a number to each outcome of a random experiment. It is usually written X. The number need not itself be uncertain after the experiment; it is uncertain before the outcome is known.
Discrete means countable separate values; continuous means values over a continuum/interval. A measured continuous quantity is often rounded in practice, but its model can still be continuous.
1.2 PMF, PDF and CDF
A probability mass function (PMF) gives the probability of each value of a discrete random variable. A probability density function (PDF) describes density for a continuous variable; probabilities are areas, not heights. The cumulative distribution function (CDF) gives the probability that X is at most x.
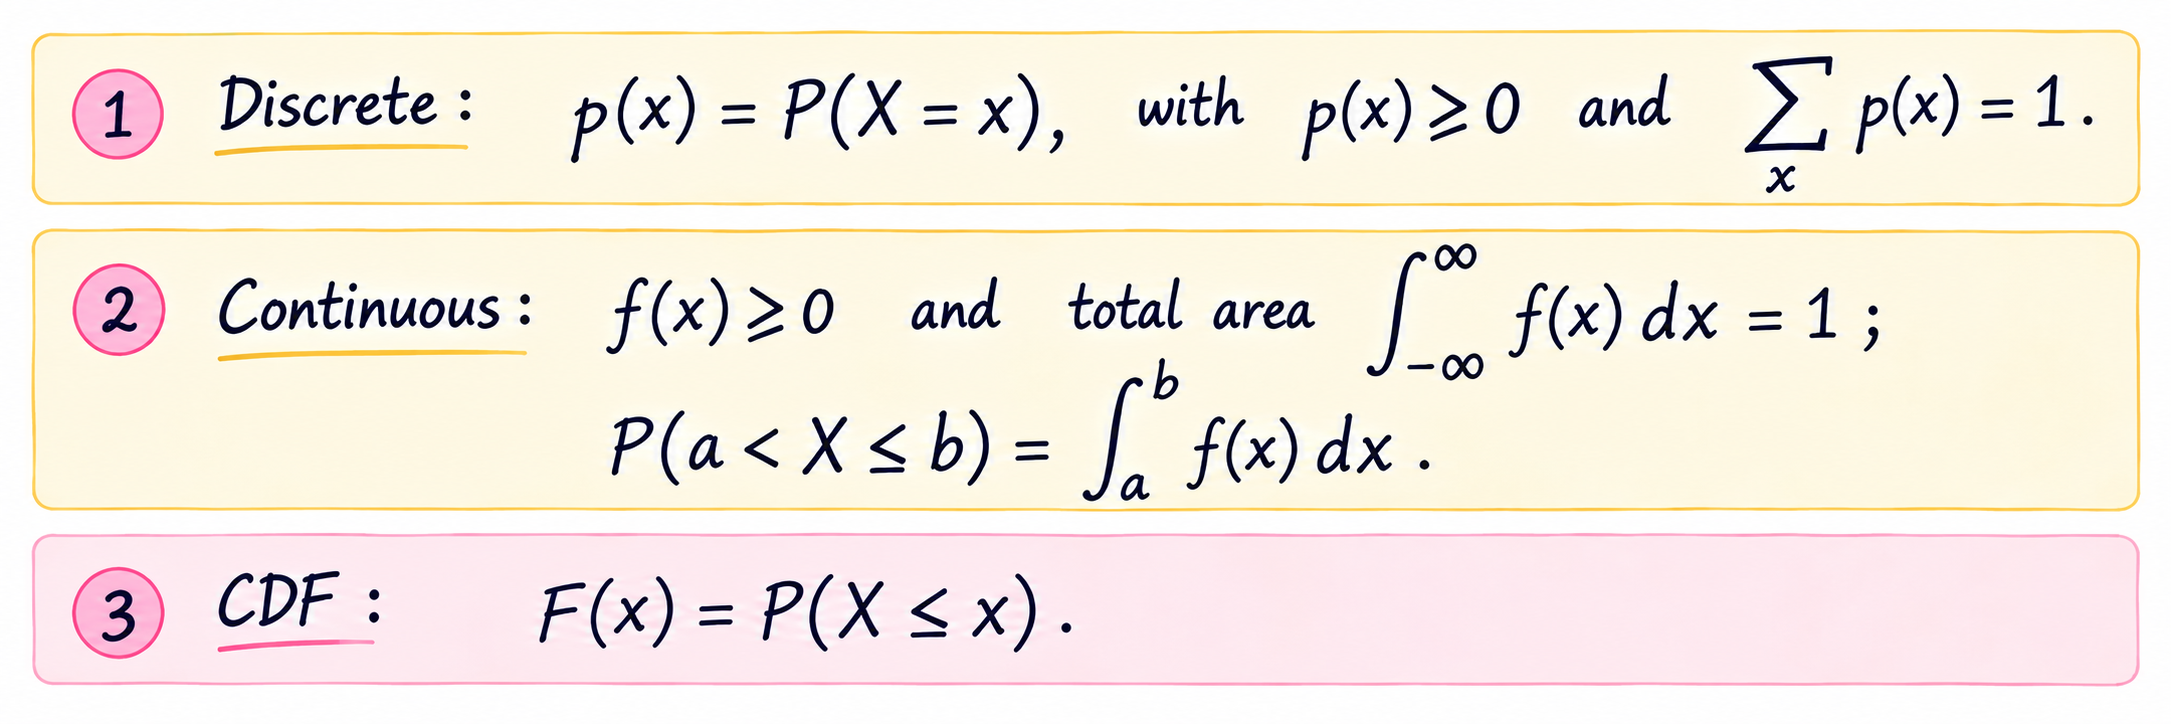
For a discrete X, add PMF values up to x. For a continuous X, integrate the PDF up to x. A CDF never decreases, approaches 0 far to the left and 1 far to the right, and probability over an interval is obtained from the difference of CDF values.
1.3 Functions and transformations (univariate)
If X is random and Y=g(X), then Y is also random. A transformation changes the value assigned to each outcome. For a discrete variable, list possible X values, calculate g(x), and combine probabilities when different x values produce the same y.
For a continuous variable, one basic method is to find the CDF of Y from Fᵧ(y)=P(g(X)≤y), then differentiate when the resulting CDF has a density.
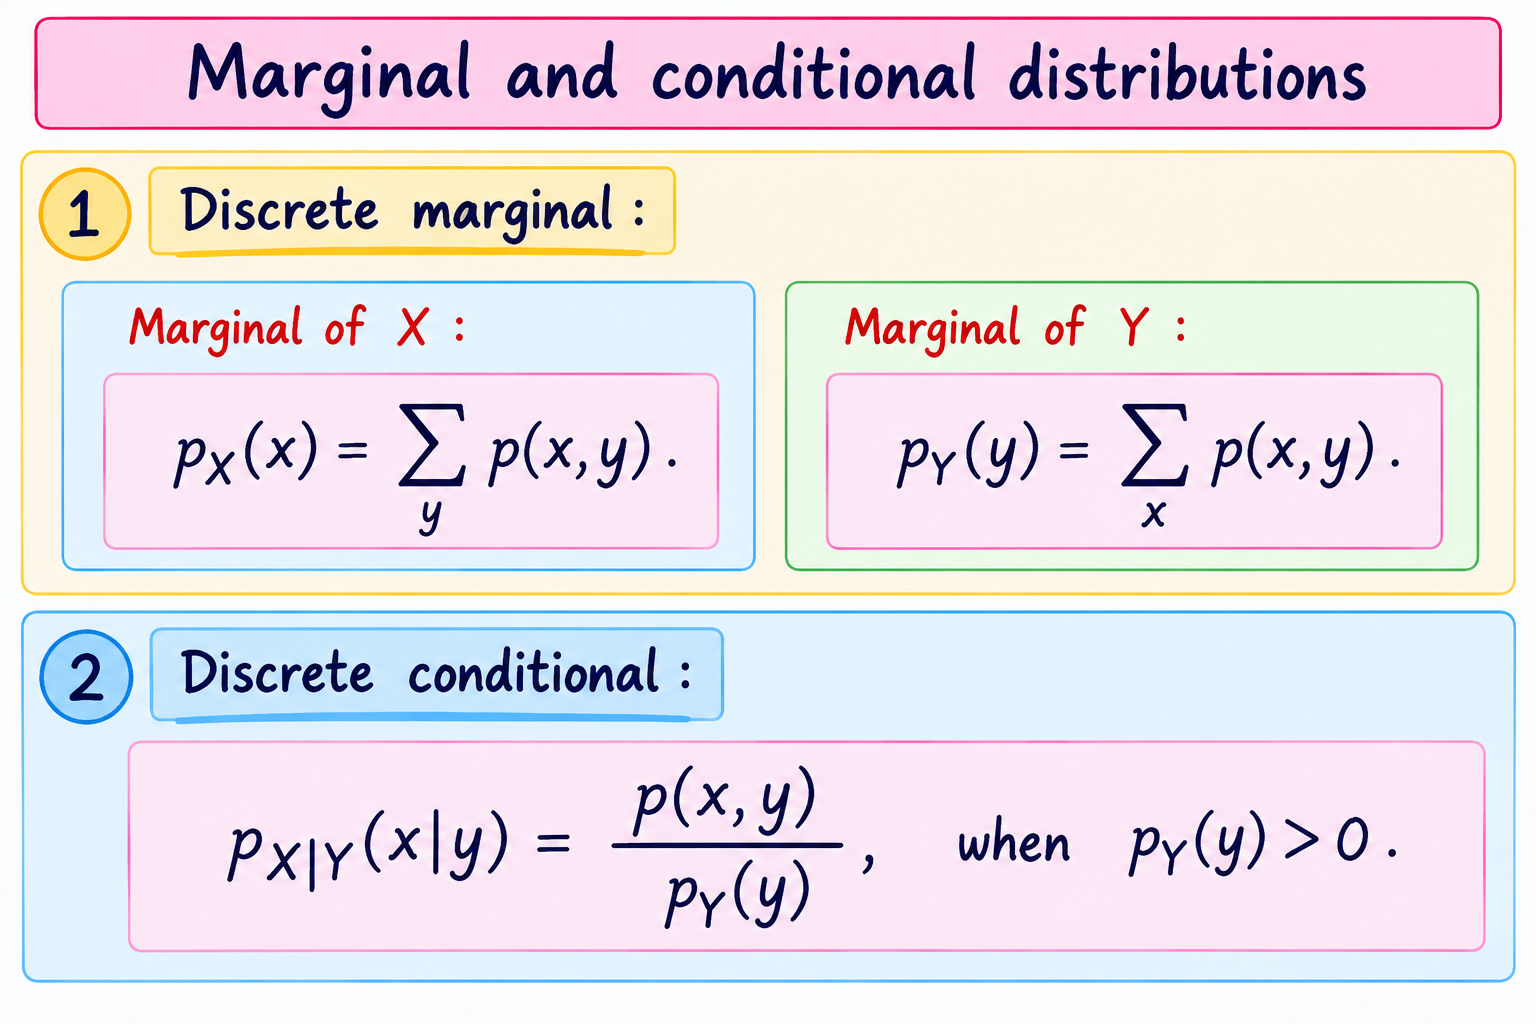
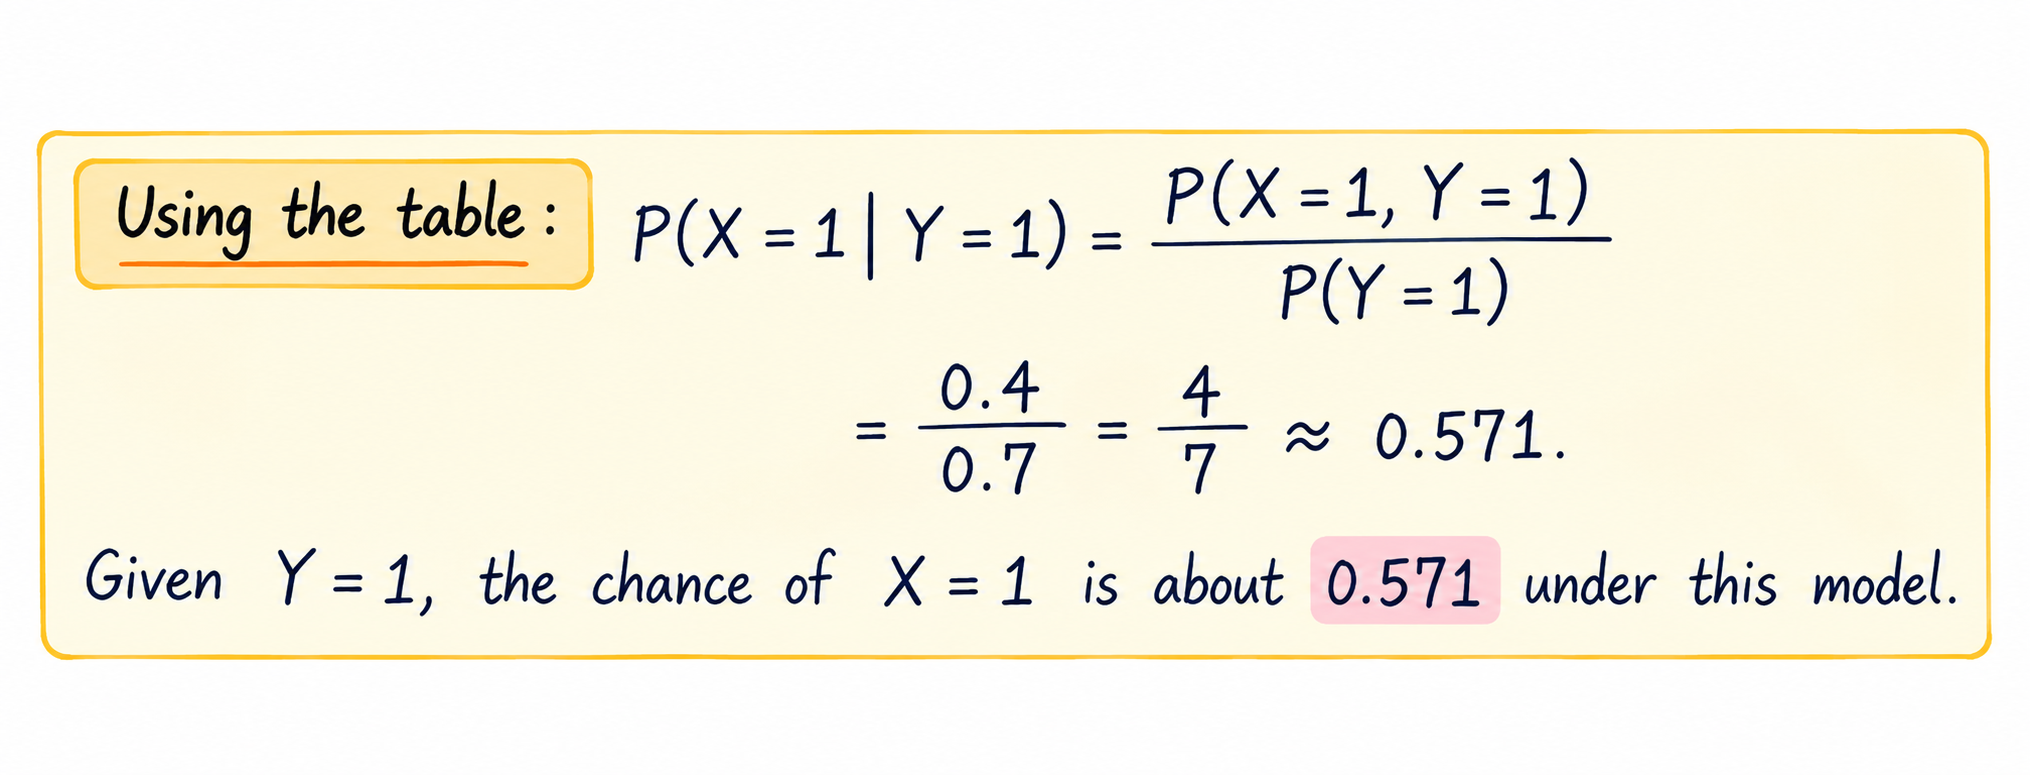
For continuous variables, replace sums with integrals and divide joint density by the relevant marginal density.
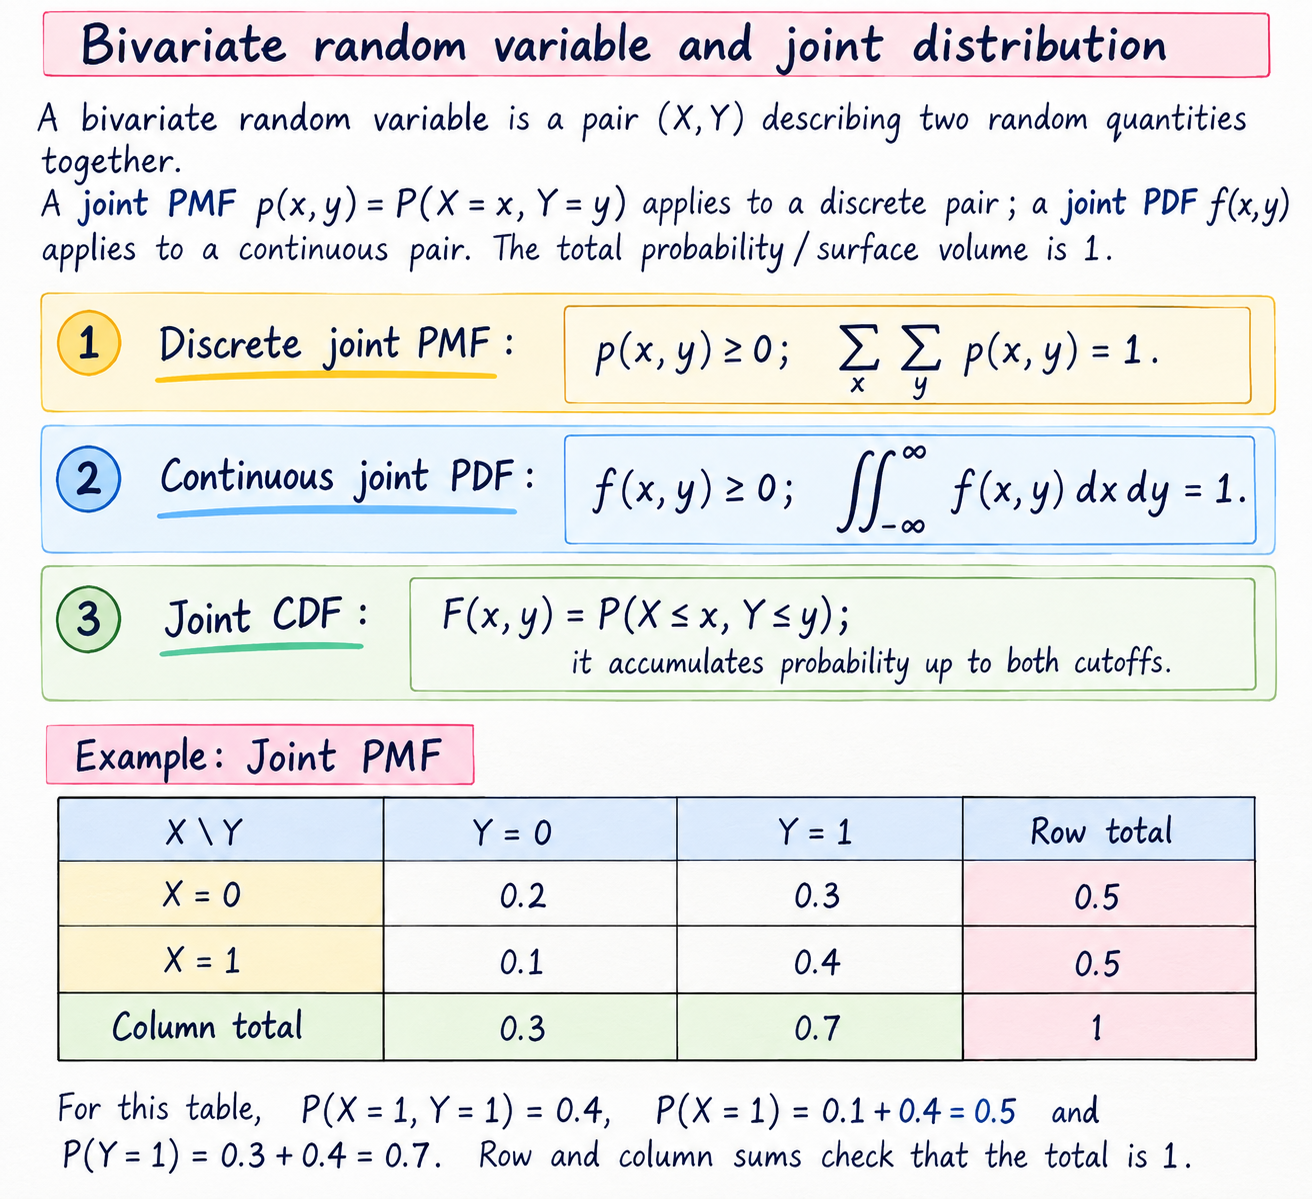
X and Y are independent if knowing one does not change the distribution of the other. For discrete variables, check p(x,y)=pX(x)pY(y) for all pairs. In the table, p(1,1)=0.4 but pX(1)pY(1)=0.5×0.7=0.35, so X and Y are not independent.
Module 1 recap
Key ideas: random variable; discrete/continuous support; PMF; PDF; CDF; transformation; joint distribution; marginal; conditional; independence.
Expected / Exam-Focused Questions based on the syllabus: define a random variable; state PMF/PDF/CDF properties; obtain a marginal from a joint table; calculate a conditional distribution; test independence; find the distribution of a simple discrete transformation.
Self-test: (1) Is number of arrivals in an hour discrete or continuous? (2) What is the difference between a PDF value and interval probability? (3) From the table, find P(X=0). (4) Find P(Y=0|X=1). (5) Does a marginal retain information about the other variable?
Mathematical expectation
You will learn: expectation and its properties; common averages and variability in expectation notation; moment-generating and characteristic functions.
Why it matters: a whole probability distribution can be hard to describe. Expectation and variance provide concise summaries; generating functions encode moments in a useful form.
Concept route: weighted average → summaries of spread → transform of distribution → recover moments/properties.
2.1 Mathematical expectation
Expectation is the long-run probability-weighted average of a random variable. It is not necessarily a value the variable can actually take.
Each possible value is weighted by its probability or density; for a valid finite expectation, the required sum/integral must exist.
Linearity: E(aX+b)=aE(X)+b. For sums, E(X+Y)=E(X)+E(Y), even without independence, provided expectations exist.
2.2 AM, GM, HM, mean deviation and variance in terms of expectation
Variance is expected squared distance from the mean. Standard deviation is its square root, returning to the original measurement units.
For a random variable, the probability-weighted arithmetic mean is E(X). For positive values, geometric and harmonic means can be expressed using logs and reciprocal values: GM=exp(E[ln X]) and HM=1/E(1/X), where the expectations exist. For a finite equally weighted data set these reduce to the familiar formulas from Semester 1. The syllabus asks for simple problems.
Useful properties: Var(aX+b)=a²Var(X); adding a constant shifts the mean but not the spread. If X and Y are independent, Var(X+Y)=Var(X)+Var(Y). Do not apply the last equality without the independence condition (or other appropriate covariance information).
2.3 Moment-generating and characteristic functions
A generating function turns distribution information into a function. Differentiating a moment-generating function at zero gives moments when it exists near zero.
For independent variables, the MGF of a sum is the product of their MGFs when the relevant MGFs exist. This can simplify sums and help identify distributions.
The characteristic function exists for every probability distribution and is complex-valued in general. It also encodes distribution information. At this syllabus level focus on definition, properties covered in class and simple problems, not advanced inversion theory.
Module 2 recap
Key ideas: probability-weighted average; linearity; raw and central moments; expectation forms of means; variance; MGF; characteristic function.
Expected / Exam-Focused Questions: calculate E(X) and Var(X) from a PMF; show a simple expectation property numerically; find mean/variance using an MGF; define and distinguish MGF and characteristic function.
Self-test: (1) Can E(X) lie between possible values? (2) If E(X)=3 and E(X²)=11, find variance. (3) What happens to variance under X+5? (4) What is M(0)? (5) What is the Bernoulli MGF?
Discrete and continuous distributions
You will learn: discrete uniform, Bernoulli, binomial, Poisson, geometric, continuous uniform, exponential, gamma and normal distributions.
Why it matters: each model captures a recurring pattern of uncertainty. Recognising the situation lets us calculate probabilities efficiently.
Suggested method: identify discrete/continuous, define X and its support, choose a model, write parameter values, compute, then interpret.
3.1 Discrete uniform, Bernoulli and binomial
Discrete uniform: each of the n listed outcomes has probability 1/n. For a fair six-sided die, P(X=x)=1/6 for x=1,…,6.
Bernoulli: one trial with two outcomes, coded success (1) with probability p and failure (0) with probability 1−p. Mean p; variance p(1−p).
Binomial: counts successes in n independent Bernoulli trials with the same success probability p.
C(n,k) counts ways to place k successes among n trials. The factors represent k successes and n−k failures. Check fixed n, two outcomes per trial, constant p and independence.
3.2 Poisson and geometric distributions
Poisson: models a count of occurrences in a specified interval when an average rate λ is appropriate. Support is 0,1,2,…
Geometric: number of independent trials up to and including the first success, with constant success chance p. This guide uses support 1,2,…; state the convention because some texts count failures before success.
The last equality is the lack-of-memory property: conditional on still waiting after m failures, the additional wait has the original geometric distribution.
3.3 Continuous uniform distribution
If X is equally spread across an interval [a,b], its density is constant there. Probability is interval length divided by total length.
3.4 Exponential and gamma distributions
Exponential: models a nonnegative waiting time with rate λ>0.
The exponential distribution has lack of memory: P(X>s+t | X>s)=P(X>t). Knowing that a wait has already lasted s does not change the model distribution of the additional wait.
Gamma: a continuous distribution on x>0 with shape α>0 and rate λ>0 in the rate parameterisation below. It generalises waiting-time models; when α=1 it is exponential with rate λ.
Γ(α) is the gamma function/normalising factor that makes total density area 1. If your class uses a scale parameter θ=1/λ, use the corresponding form and state which parameterisation you use.
3.5 Normal distribution and standard normal table
The normal distribution is a continuous, symmetric, bell-shaped model determined by mean μ and variance σ². Values near μ are more common; the curve’s total area is 1.
Standardisation measures how many standard deviations x lies above or below the mean. A standard normal table may give left-tail Φ(z)=P(Z≤z); always check the table heading.
For intervals, translate both endpoints to z-scores and use the table consistently: P(a<X<b)=Φ(zᵦ)−Φ(zₐ). Symmetry gives Φ(−z)=1−Φ(z).
Module 3 recap
Key ideas: uniform discrete; Bernoulli; binomial; Poisson; geometric; continuous uniform; exponential; gamma; normal; standard normal.
Expected / Exam-Focused Questions: identify a distribution from a situation; state its support and parameters; calculate a binomial/Poisson probability; explain geometric or exponential memorylessness; calculate normal probabilities with a standard table.
Self-test: (1) Which model counts successes in fixed n trials? (2) For Poisson λ=3, what are mean and variance? (3) What does p mean in a geometric model? (4) Standardise x=75 when μ=65, σ=5. (5) If X~Uniform(2,8), calculate P(X>5).
Spreadsheet for statistical computing
Course requirement: use spreadsheet functions for numerical problems associated with the modules. A practical record with at least 10 problems must be submitted.
Workflow: enter/label inputs → select model and parameters → use spreadsheet formulas/functions → check against theory or a small manual calculation → interpret output → record procedure.
Ten-plus practical record ideas
- Create a discrete PMF table; check probabilities sum to 1; calculate its CDF.
- Use a joint PMF table to obtain marginal distributions and verify totals.
- Calculate a conditional distribution from a joint table; test independence.
- Calculate E(X), E(X²), variance and standard deviation from a PMF.
- Use a Bernoulli/binomial function or formula to calculate event probabilities.
- Calculate Poisson probabilities for several k values and compare cumulative probability.
- Calculate geometric probabilities and verify a finite partial sum is at most 1.
- Use continuous uniform and exponential CDF formulas for interval/tail probabilities.
- Standardise observations and use the software’s normal CDF/inverse functions; compare with a standard normal table.
- Simulate repeated Bernoulli trials using a random-number function; compare empirical proportion with p.
- Simulate binomial counts or waiting times and compare a frequency graph with theoretical probabilities.
Use the software available in your practical class. Function names differ; typical spreadsheet programs provide binomial, Poisson and normal distribution functions and random-number generation. Record the exact function and argument order used.
Practical/viva preparation
- What do PMF, PDF and CDF spreadsheet outputs represent?
- How do you check that a discrete distribution is valid?
- How do you obtain a marginal distribution from joint data?
- Which cell references change when a formula is copied? How can a reference be made absolute?
- Why does a simulation not exactly equal its theoretical probability in a finite number of trials?
- How can you compare observed and theoretical probabilities using a table or graph?
- How did you choose the distribution and its parameters in your practical record?
For each submitted record problem, include: objective, given data/parameters, formula or function, output, one verification, interpretation and conclusion.